Retirement used to mean leaving work at 65 with a pension and predictable expenses. Today, retirement planning is far more complex. Rising healthcare costs, inflation, longer life expectancy, and market uncertainty mean one question matters more than ever: how much money do you actually need to retire comfortably?
The short answer: most Americans need somewhere between $1 million and $2.5 million depending on lifestyle, location, healthcare costs, and retirement age. But the real answer depends on your personal situation — and this guide gives you a step-by-step framework to find it.
Project your exact number: Use the CalcMeter Retirement Calculator to see your projected balance, find your required monthly savings, and test how long your money will last — formula shown for every result.
The Simple Formula: How Much Do You Need to Retire?
Most financial planners use one starting point:
Examples:
$40,000/year expenses → $1,000,000 nest egg
$60,000/year expenses → $1,500,000 nest egg
$80,000/year expenses → $2,000,000 nest egg
adjust annually for inflation, and historically the portfolio lasts 30+ years.
This comes from the famous 4% retirement withdrawal rule. Multiply your expected annual retirement expenses by 25, and you get the portfolio size needed to sustain those withdrawals without depleting your savings over a normal retirement.
What Is the 4% Rule?
The 4% rule originated from the Trinity Study, which analyzed historical US stock and bond market returns over multiple decades. The conclusion was straightforward: a retiree who withdraws 4% of their portfolio in year one, then adjusts that dollar amount for inflation each subsequent year, has historically sustained their portfolio for approximately 30 years.
How the 4% Rule Works in Practice
- Withdraw 4% of your portfolio in your first retirement year
- Adjust that dollar amount annually for inflation (not a new 4% of the remaining balance)
- The portfolio historically survived 30 years with a roughly 60/40 stock-bond allocation
A $1.5M portfolio can generate ~$60,000 annually at a 4% withdrawal rate.
However, many modern retirement planners now recommend adjustments:
- 3%–3.5% for early retirement (age 55–60) due to longer drawdown periods
- Lower withdrawal rates during high inflation periods when portfolio returns may lag
- Flexible withdrawals — reducing spending during market downturns to preserve capital
Social Security reduces your required portfolio. The average US benefit at full retirement age is ~$22,000/year in 2026. At a 4% rate, that's the equivalent of a $550,000 nest egg you don't need to save yourself. Always subtract guaranteed income before applying the 4% rule.
The Biggest Retirement Planning Mistake
Most people underestimate two things: how long retirement lasts and how much inflation increases expenses. A healthy 65-year-old today may spend 25–35 years in retirement. That means your portfolio must survive inflation, market crashes, rising healthcare costs, and compounding living expenses — for decades.
The Inflation Math People Miss
At just 3% annual inflation — roughly the US historical average — your purchasing power erodes dramatically over time:
| Today's Expense | In 10 Years | In 20 Years | In 30 Years |
|---|---|---|---|
| $50,000/yr | $67,196 | $90,306 | $121,363 |
| $70,000/yr | $94,074 | $126,428 | $169,908 |
| $100,000/yr | $134,392 | $180,611 | $242,726 |
This is why the retirement calculator includes an inflation rate input — projecting results in today's dollars shows the real purchasing power of your future balance, not just its nominal size.
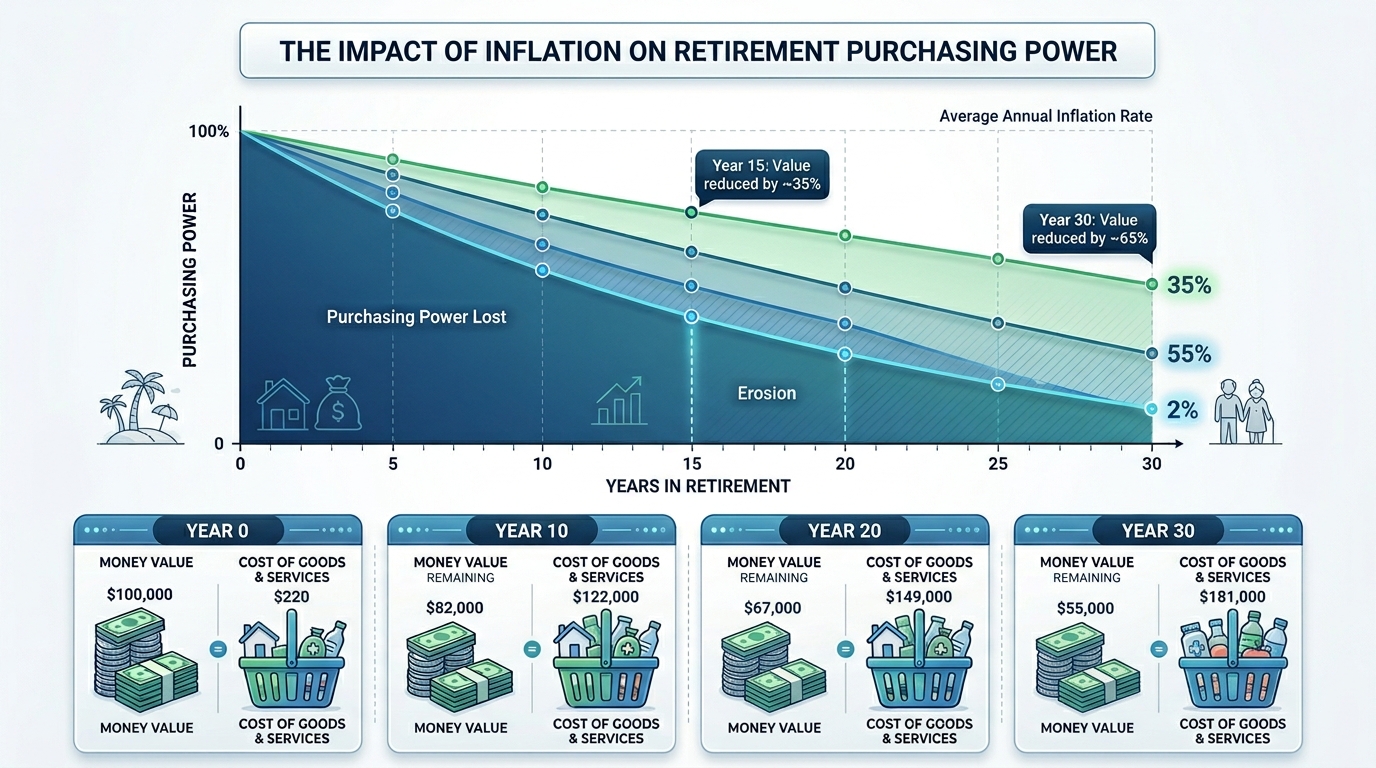
At 3% inflation, $50,000/year in expenses today costs over $121,000/year in 30 years — nearly 2.5× more.
Is $1 Million Enough to Retire in 2026?
Whether $1 million is enough depends heavily on where you live, your debt situation, healthcare needs, and lifestyle expectations.
In Lower-Cost States
In states like Mississippi, Arkansas, Oklahoma, or West Virginia, $1 million may comfortably support modest travel, paid-off housing, and a comfortable lifestyle — especially combined with Social Security income of $20,000–$30,000/year.
In Expensive Cities
In New York City, San Francisco, Boston, or Seattle, $1 million feels restrictive fast. Housing, healthcare, taxes, and daily expenses are dramatically higher, and $40,000/year from a $1M portfolio may not cover rent alone in some areas.
+ Average Social Security: ~$22,000/year
= ~$62,000/year total (before taxes)
Retirement Savings Benchmarks by Age
Fidelity and other major financial institutions publish rough savings milestones tied to your annual salary. These aren't strict rules — but they're a useful progress indicator:
| Age | Suggested Savings Target | Example ($80k salary) | Status |
|---|---|---|---|
| 30 | 1× annual salary | $80,000 | Building |
| 40 | 3× annual salary | $240,000 | Growing |
| 50 | 6× annual salary | $480,000 | Accelerating |
| 60–67 | 8–10× annual salary | $640,000–$800,000+ | Target Zone |
Behind on these benchmarks? Don't panic — focus on maximizing contributions now. At age 50+, the IRS allows catch-up contributions: $31,000/year in a 401(k) (vs. $23,500 under 50) and $8,000/year in an IRA (vs. $7,000). Use the retirement calculator to find the monthly savings needed to close the gap.
How Much Should You Save Monthly for Retirement?
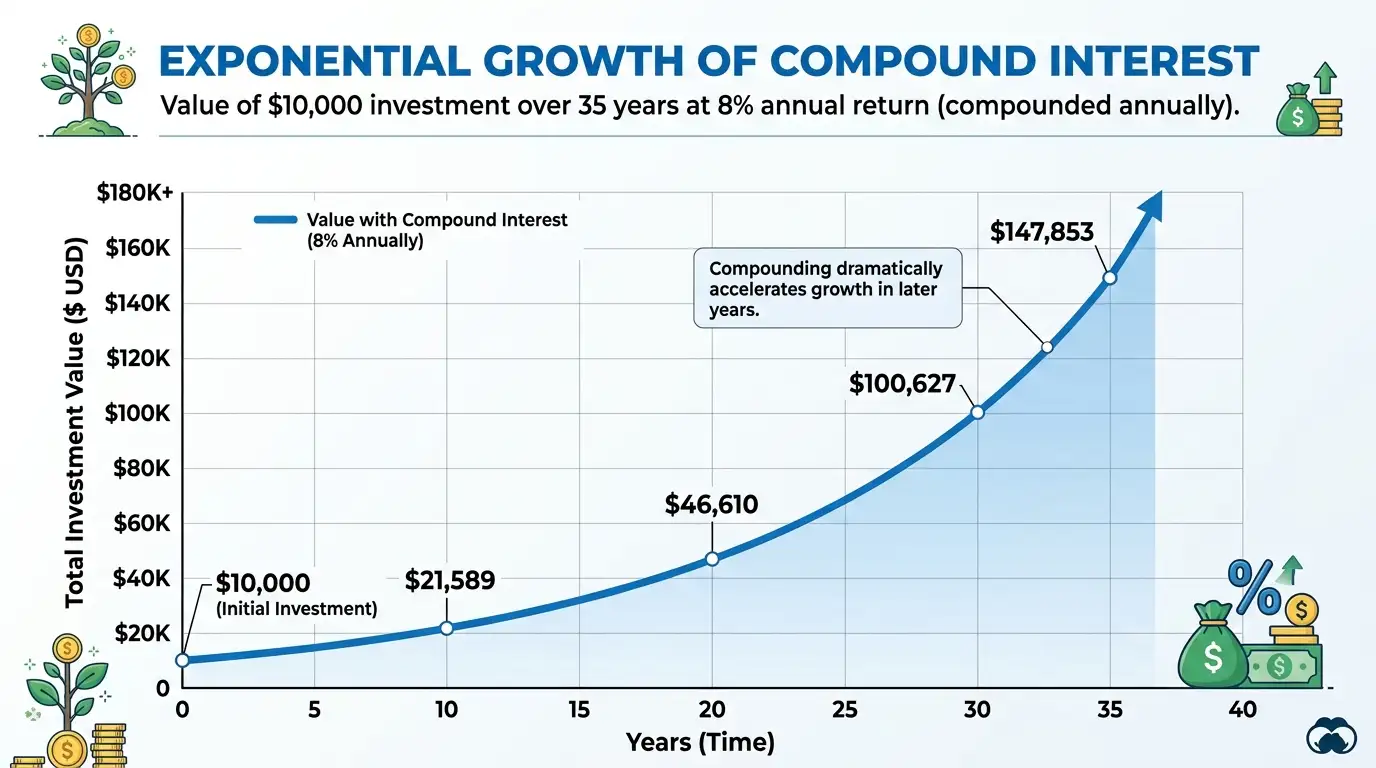
Monthly savings depends on your current age, target retirement age, expected investment return, and your retirement income goal. Someone starting at 25 can save dramatically less per month than someone starting at 40 to reach the same balance — because of compound interest.
The Power of Starting Early: A Real Example
| Investor | Starts At | Monthly Contribution | At Age 65 (7% return) |
|---|---|---|---|
| Investor A | Age 25 | $400/month | ~$1.06M |
| Investor B | Age 35 | $800/month | ~$983K |
Investor B contributes twice as much each month but still ends up with less money — purely because they started 10 years later. This is the compounding gap: losing 10 years of early growth can never fully be offset by doubling contributions later.
$500/month · r = 7%÷12 = 0.005833 · n = 480 months
FV = 500 × [(1.005833)^480 − 1] / 0.005833
FV = ~$1,310,000 (you contributed $240,000)
Compound interest generates ~$1,070,000 on top of your $240,000 in contributions.
Find your exact monthly savings target
Enter your age, retirement age, current savings, and target nest egg — the calculator tells you the monthly contribution needed to reach it, with the formula shown.
Open Monthly Goal CalculatorHow Social Security Affects Your Retirement Number
Many Americans undercount Social Security when estimating retirement needs — and this leads to oversaving anxiety or undersaving risk. Social Security can meaningfully reduce how much your portfolio must generate.
Social Security in 2026
- Average benefit at full retirement age (67): ~$22,000/year
- Delaying to age 70 increases your benefit by roughly 8% per year past full retirement age
- Benefits are partially taxable depending on total income
Social Security: −$25,000/year
Portfolio must generate: $45,000/year
Required portfolio = $45,000 ÷ 0.04 = $1,125,000
Without SS: $70,000 ÷ 0.04 = $1,750,000
Social Security saves ~$625,000 in required savings.
Get your personalized Social Security estimate at ssa.gov and enter your monthly benefit in the retirement calculator's advanced options to see how it changes your projection.
Best Retirement Accounts to Build Wealth
1. 401(k) — Employer-Sponsored Plan
The 401(k) is the backbone of American retirement savings. Always contribute at least enough to capture your full employer match — that's an instant 50%–100% return before any market gains. The 2026 contribution limit is $23,500 (under 50) or $31,000 at age 50+ with catch-up contributions.
2. Roth IRA — Tax-Free Growth
Roth IRA contributions are made with post-tax dollars, but growth and qualified withdrawals are completely tax-free. The 2026 limit is $7,000 ($8,000 at 50+). Roth IRAs also have no required minimum distributions during your lifetime, making them powerful for long-term growth and estate planning.
3. Traditional IRA — Tax Deduction Today
Traditional IRA contributions may be tax-deductible today (depending on income and workplace plan access), reducing your taxable income now. Withdrawals in retirement are taxed as ordinary income. Best for those who expect to be in a lower tax bracket in retirement.
4. HSA — The Triple Tax Advantage
The Health Savings Account is often overlooked but extremely powerful. Contributions are pre-tax, growth is tax-free, and withdrawals for qualified medical expenses are tax-free — three tax advantages on the same account. After age 65, HSA funds can be withdrawn for any purpose (taxed like a Traditional IRA). The 2026 limit is $4,300 for individuals.
Optimal contribution order: (1) 401(k) up to full employer match → (2) max Roth IRA → (3) max HSA if eligible → (4) return to max 401(k) → (5) taxable brokerage account. This sequence captures every available tax advantage before investing in taxable accounts.
Common Retirement Planning Mistakes
Waiting Too Long to Start
Every year of delay costs more than the contributions themselves — you lose compound growth on all future gains. Someone who starts at 35 instead of 25 must typically save 2×–3× as much per month to reach the same balance. Start immediately, even with a small amount.
Ignoring Inflation
Assuming today's expenses will be the same in 20 years is a critical error. Build in 2.5%–3.5% annual inflation when projecting retirement income needs. The retirement calculator's "inflation rate" field adjusts your result to show what today's dollars will actually be worth.
Overestimating Investment Returns
Planning around 12% annual returns forever is unrealistic. A conservative 5%–7% projection (roughly the real after-inflation return of the S&P 500) produces far more useful long-term estimates. Run a pessimistic (5%) and optimistic (9%) scenario to understand your range.
Underestimating Healthcare Costs
Fidelity estimates a 65-year-old couple will need roughly $315,000 for healthcare costs in retirement (2024 figure), not covered by Medicare. This is one of the largest and most unpredictable retirement expenses — plan for it explicitly.
Retiring With High-Interest Debt
High-interest debt dramatically increases the income your portfolio must generate. A $500/month debt payment requires an extra $150,000 in portfolio value at a 4% withdrawal rate. Enter retirement debt-free whenever possible.
How to Calculate Your Retirement Number: Step by Step
-
1
Estimate annual retirement expenses. Include housing (mortgage or rent), food, healthcare premiums and out-of-pocket costs, travel, insurance, taxes, and hobbies. Be honest about your lifestyle expectations — most retirees spend 70%–90% of pre-retirement income.
-
2
Subtract guaranteed income. Subtract estimated Social Security benefits (get your figure at ssa.gov), any pension income, and rental income. The remainder is what your portfolio must generate annually.
-
3
Apply the 4% rule. Divide the remaining annual income need by 0.04 to find your required portfolio size. For a 40+ year retirement, divide by 0.03 or 0.035 instead.
-
4
Use a retirement calculator. Enter your current age, retirement age, existing savings, and the target portfolio size to find the monthly contribution needed — and the year-by-year growth path to get there.
Project your savings in 60 seconds
Enter your numbers and see your retirement balance, monthly savings target, and how long your money will last — with the formula shown for every result. Free, no signup.
Open Retirement CalculatorFinal Thoughts
Retirement planning is not about hitting a single magic number. It's about building enough financial flexibility to support your lifestyle, cover healthcare, and fund 25–35 years of living. For some people that's $700,000; for others it's $3 million or more.
What is universal: starting early and investing consistently are the two most powerful levers. Even small monthly contributions become extraordinary over decades due to compound growth. A 25-year-old investing $200/month at 7% accumulates over $525,000 by age 65 — on just $96,000 of total contributions.
The second most important step is protecting against inflation. Run your projections in today's dollars to see what your future balance actually buys — not just its nominal size. And factor in Social Security early so you understand how much your portfolio truly needs to generate.
Use the retirement calculator to run all three views: your savings projection, the monthly contribution needed to hit a specific target, and how long your balance will last at your planned withdrawal rate. The formulas are shown for every result so you can verify the math yourself.
Frequently Asked Questions
Most Americans need between $1 million and $2.5 million, depending on lifestyle, retirement age, healthcare costs, and location. The 4% rule formula: multiply your desired annual income from savings by 25. Want $60,000/year from your portfolio? You need $1.5 million. First subtract guaranteed income like Social Security (~$22,000/year on average at full retirement age in 2026), because that reduces what your savings must produce.
For many US households, yes. At a 4% withdrawal rate, $2 million generates $80,000/year before taxes. Add Social Security and total household income could exceed $100,000/year. Whether that's enough depends on your location, healthcare costs, debt, and lifestyle. It's very comfortable in lower-cost states and workable in most cities — but may feel tight in the most expensive urban areas.
Yes, but early retirement requires larger savings and a lower withdrawal rate — use 3%–3.5% instead of 4% to account for a potentially 35–40 year retirement. You can't claim Social Security until 62 (reduced) or 67 (full), and most 401(k)/IRA withdrawals are penalty-free only at 59½. A bridge from taxable accounts or a 72(t)/SEPP plan may be needed for the first few years. Use the Projection tab in the calculator to see your balance at age 55, then test it in the How Long Will It Last tab.
Most financial planners consider 3%–4% sustainable over a 30-year retirement with a balanced 60/40 stock-bond portfolio. The original 4% rule (Trinity Study, 1998) used historical US market data from 1926–1995. For a 40-year or early retirement, 3%–3.5% provides an additional safety margin. The withdrawal calculator on CalcMeter shows exactly how many years any withdrawal rate sustains your balance, accounting for your specific return rate and inflation.
A common starting point is 15%–20% of gross income, including any employer 401(k) match. But the right amount depends on your age, existing savings, and target retirement age. Someone starting at 25 needs far less per month than someone starting at 40 to reach the same balance — compound growth is the reason. Use the Monthly Goal tab in the retirement calculator to find your exact required contribution based on your specific situation.